> For the complete documentation index, see [llms.txt](https://bryan-guner.gitbook.io/my-docs/llms.txt). Markdown versions of documentation pages are available by appending `.md` to page URLs; this page is available as [Markdown](https://bryan-guner.gitbook.io/my-docs/web_dev_tools/postman/trouble-shooting-postman.md).
# Trouble Shooting Postman
## Troubleshooting requests
There are many possible reasons for your API requests not behaving as expected. You will see a message if Postman isn't able to send your request, or if it doesn't receive a response from the API you sent the request to. The message will include an overview of the issue and a link to the Console, where you can access detailed info about the request.

Select **View in Console** to see the request detail in the Console and find out more about what went wrong.

### Contents
* [Common issues](https://learning.postman.com/docs/sending-requests/troubleshooting-api-requests/#common-issues)
* [Debugging and logs](https://learning.postman.com/docs/sending-requests/troubleshooting-api-requests/#debugging-and-logs)
* [Using the console](https://learning.postman.com/docs/sending-requests/troubleshooting-api-requests/#using-the-console)
* [Accessing console logs](https://learning.postman.com/docs/sending-requests/troubleshooting-api-requests/#accessing-console-logs)
* [Using the monitor console log](https://learning.postman.com/docs/sending-requests/troubleshooting-api-requests/#using-the-monitor-console-log)
* [Getting help](https://learning.postman.com/docs/sending-requests/troubleshooting-api-requests/#getting-help)
### Common issues
* **Connectivity**
* If Postman fails to send your request, you may be experiencing connectivity issues. Check your connection by attempting to open a page in your web browser.
* **Firewalls**
* Some firewalls may be configured to block non-browser connections. If this happens you will need to contact your network administrators for Postman to work.
* **Proxy configuration**
* If you are using a proxy server to make requests, check your configuration. By default, Postman uses the proxy settings configured in your operating system's network settings. The Postman Console will provide debugging information regarding proxy servers.
* **SSL certificates**
* You may experience issues using HTTPS connections. You can turn off SSL verification in the Postman Settings. If that does't help, your server might be using a client-side SSL connection, which you can configure in [Postman Settings](https://learning.postman.com/docs/getting-started/settings/). Use the Postman Console to ensure that the correct SSL certificate is being sent to the server.
* **Client certificates**
* Client certificates may be required for your API server. You can [add a client certificate](https://learning.postman.com/docs/sending-requests/certificates/) in the [Postman Settings](https://learning.postman.com/docs/getting-started/settings/).
* **Incorrect request URLs**
* If you are using variables or path parameters with your request, make sure the final address is structure correctly by opening the Console, which will display the URL your request was sent to when it executed. Unresolved request variables can result in invalid server addresses.
* **Incorrect protocol**
* Check if you're using `https://` instead of `http://` in your URL (or vice versa).
* **Postman errors**
* It is possible that Postman might be making invalid requests to your API server. You can confirm this by checking your server logs (if available). If you believe this is happening, get in touch with the Postman team on the [GitHub issue tracker](https://github.com/postmanlabs/postman-app-support/issues).
* **Short timeouts**
* If you configure a short timeout in Postman, the request could be timing out before completion, resulting in an error. Try increasing the timeout to avoid this issue.
* **Invalid responses**
* If your server sends incorrect response encoding errors, or invalid headers, Postman may fail to interpret the response.
> Postman supports TLS version 1.2 or higher, which [may not be supported if you are using an older browser or operating system](https://support.postman.com/hc/en-us/articles/360041392573-Deprecating-TLS-1-0-and-TLS-1-1).
### Debugging and logs
The Postman console helps debug your requests when an API isn't behaving as you expect. If you think the issue may be with Postman itself, the DevTools console provides internal debugging information you can also check out.
#### Using the console
Every request sent by Postman is logged in the console, so you can view the detail of what happened when you sent a request.
The Postman console logs the following information:
* The primary request that was sent, including all underlying request headers, variable values, redirects, etc.
* The raw response sent by the server before it's processed by Postman
* The proxy configuration and certificates used for the request
* The network information such as IP addresses, ciphers, and protocols used
* Logs from `console.log()`, `console.info()`, `console.warn()` and `console.error()` and asynchronous requests from test or pre-request scripts
Using log statements at appropriate locations in your test scripts will help you identify the source of any issues.
You can open the console from the status bar on the bottom left of Postman or selecting **View** > **Show Postman Console**. In the Postman app, you can also select **Command+Option+C** or **Ctrl+Alt+C**.

The console pane will open. You will see network information, request and response headers and body for each request, together with any console output messages coming from your scripts.
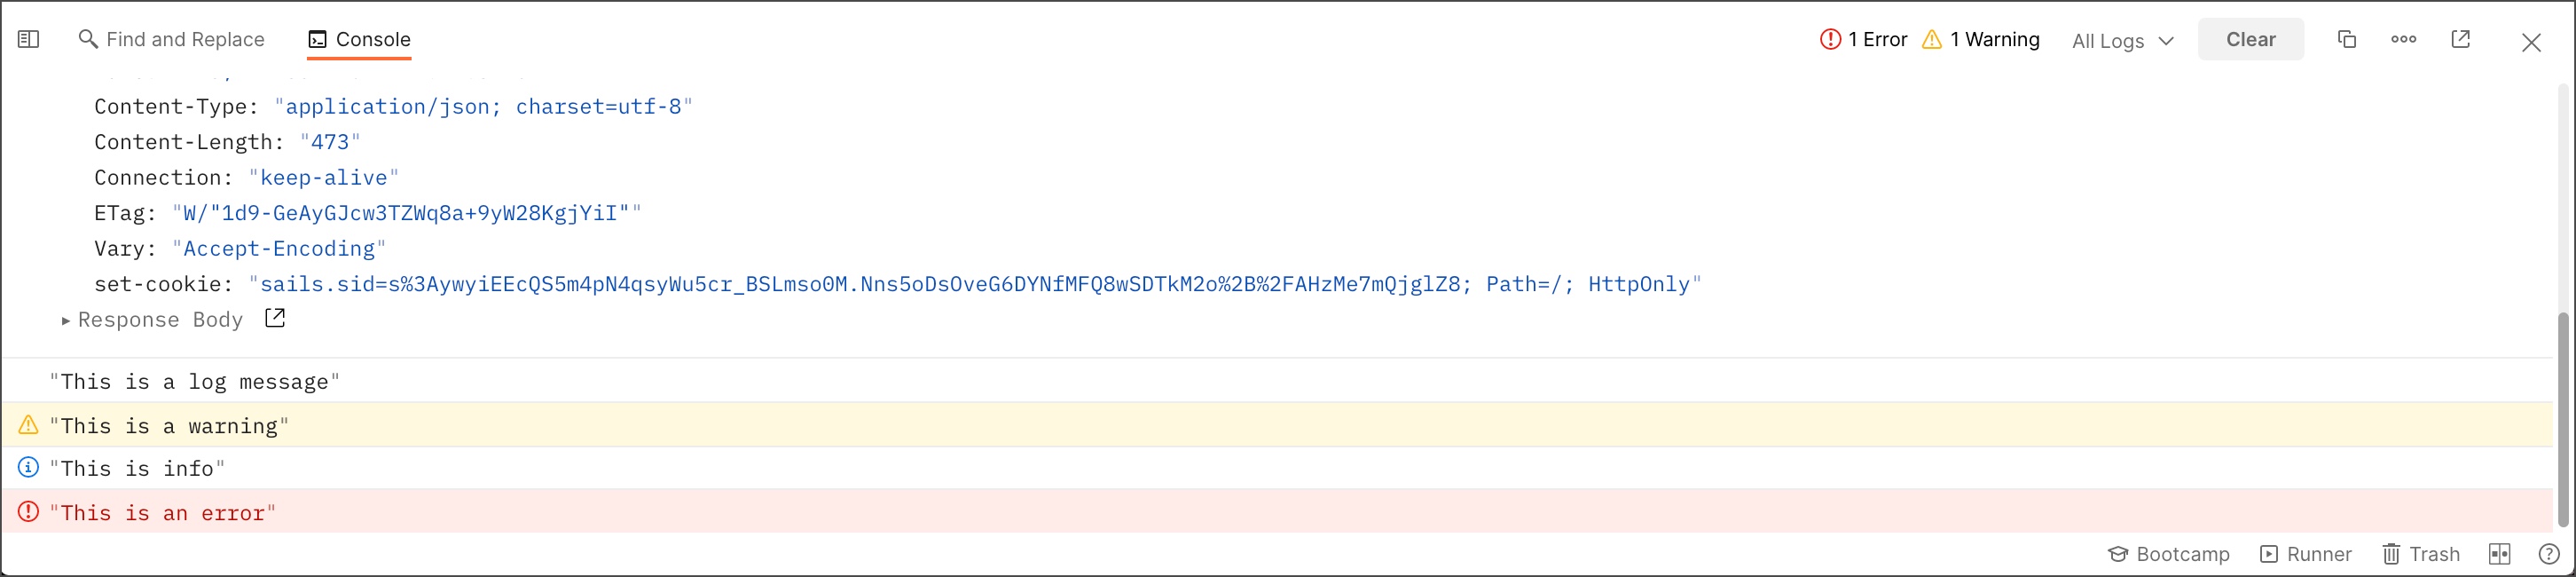
You can filter by log message type under **All Logs**, or toggle timestamps / network info.

Keeping the console open will increase the visibility of your network calls and log messages while debugging. The console will log the last 5000 messages and 24 hours by default. Select **Clear** to empty the list.
#### Accessing console logs
The DevTools console provides additional internal debugging entries for the Postman app.
To access the DevTools console logs, open the **View** menu and select **Show DevTools**. In the DevTools window, click **Console** to see the app debug logs.
#### Using the monitor console log
To view logs from a monitor run, go to the monitor and select the **Console Log** tab. This will display monitor run details, along with the `console.log` from pre-request and test scripts. See [Viewing monitor results - console log](https://learning.postman.com/docs/designing-and-developing-your-api/monitoring-your-api/viewing-monitor-results/#console-log) for more information.
### Getting help
If you still can't get your requests to work, you can ask for help in the [Postman forum](https://community.postman.com). If you've tried troubleshooting and think the problem is with Postman, search the [issue tracker](https://github.com/postmanlabs/postman-app-support/issues) on GitHub to check if someone has already reported the issue (and whether there is a known solution that you can use). If you're reporting a new issue, check out the [guidelines](https://github.com/postmanlabs/postman-app-support/#guidelines-for-reporting-issues). If you need to include confidential data, you can file a ticket with Postman [support](https://support.postman.com/hc/en-us), including your console logs to help troubleshoot.